Following on from last week’s non-stop thrill-ride through Financial KPIs, we now look to the Property KPIs that Manston monitor most closely.
Again – this is not an exclusive list (even of the measures that we monitor), but it is what works well for us – in ensuring that we retain a suitably balanced, appropriately risk weighted portfolio. These need to be meaningful both to the executive for management and portfolio construction/stewardship purposes, but also clear and accessible for our NEDs.
To re-iterate from last week – none of these KPIs really exist in isolation – and some are only truly meaningful when considered alongside Financial or Lease KPIs as well.
Property
- Portfolio Weightings
-
- (Income)
- (Capital)
- Property Concentration
- Portfolio EPC
- Charging – book val. Splits
- Vacant Property Costs
- Empty Property Costs
- Lost Rent
- (Net Cash Overage/Underage on Sales)
Portfolio Weightings – Income & Capital
Nice obvious one to start with, and one of the most important from a portfolio construction & stewardship approach.
For Manston – as a multi-sector investor, it is important for us to keep close track over how much of our portfolio is in any given sub-sector. Internally – we cut across Industrial, Office, Retail (High St.), Retail (Out of Town), Leisure & Other (inc. Land).
Historically – we held a much more balanced (numerically, if not strategically!) portfolio – aiming for relatively even splits across Retail, Office and Industrial sectors.
This raises a very interesting point about KPIs and associated targets. Whilst targets can be helpful for any business – it can sometimes be tempting to allow the target ‘tail’ to wag the performance ‘dog’. Historically Manston had strict capital allocation targets for its sector weightings – we don’t anymore. If a sector is going great-guns we don’t want to be barred from leaning into it – likewise if a sector is struggling – do we really want to be doubling down? This isn’t to say we abandon any sense of cross-sector balance, but we recognise that a dynamic balance is preferable to a strategic strait-jacket.
Over the last decade however – taking a more strategic approach to asset acquisition, disposal and management – we have seen significant re-weightings:
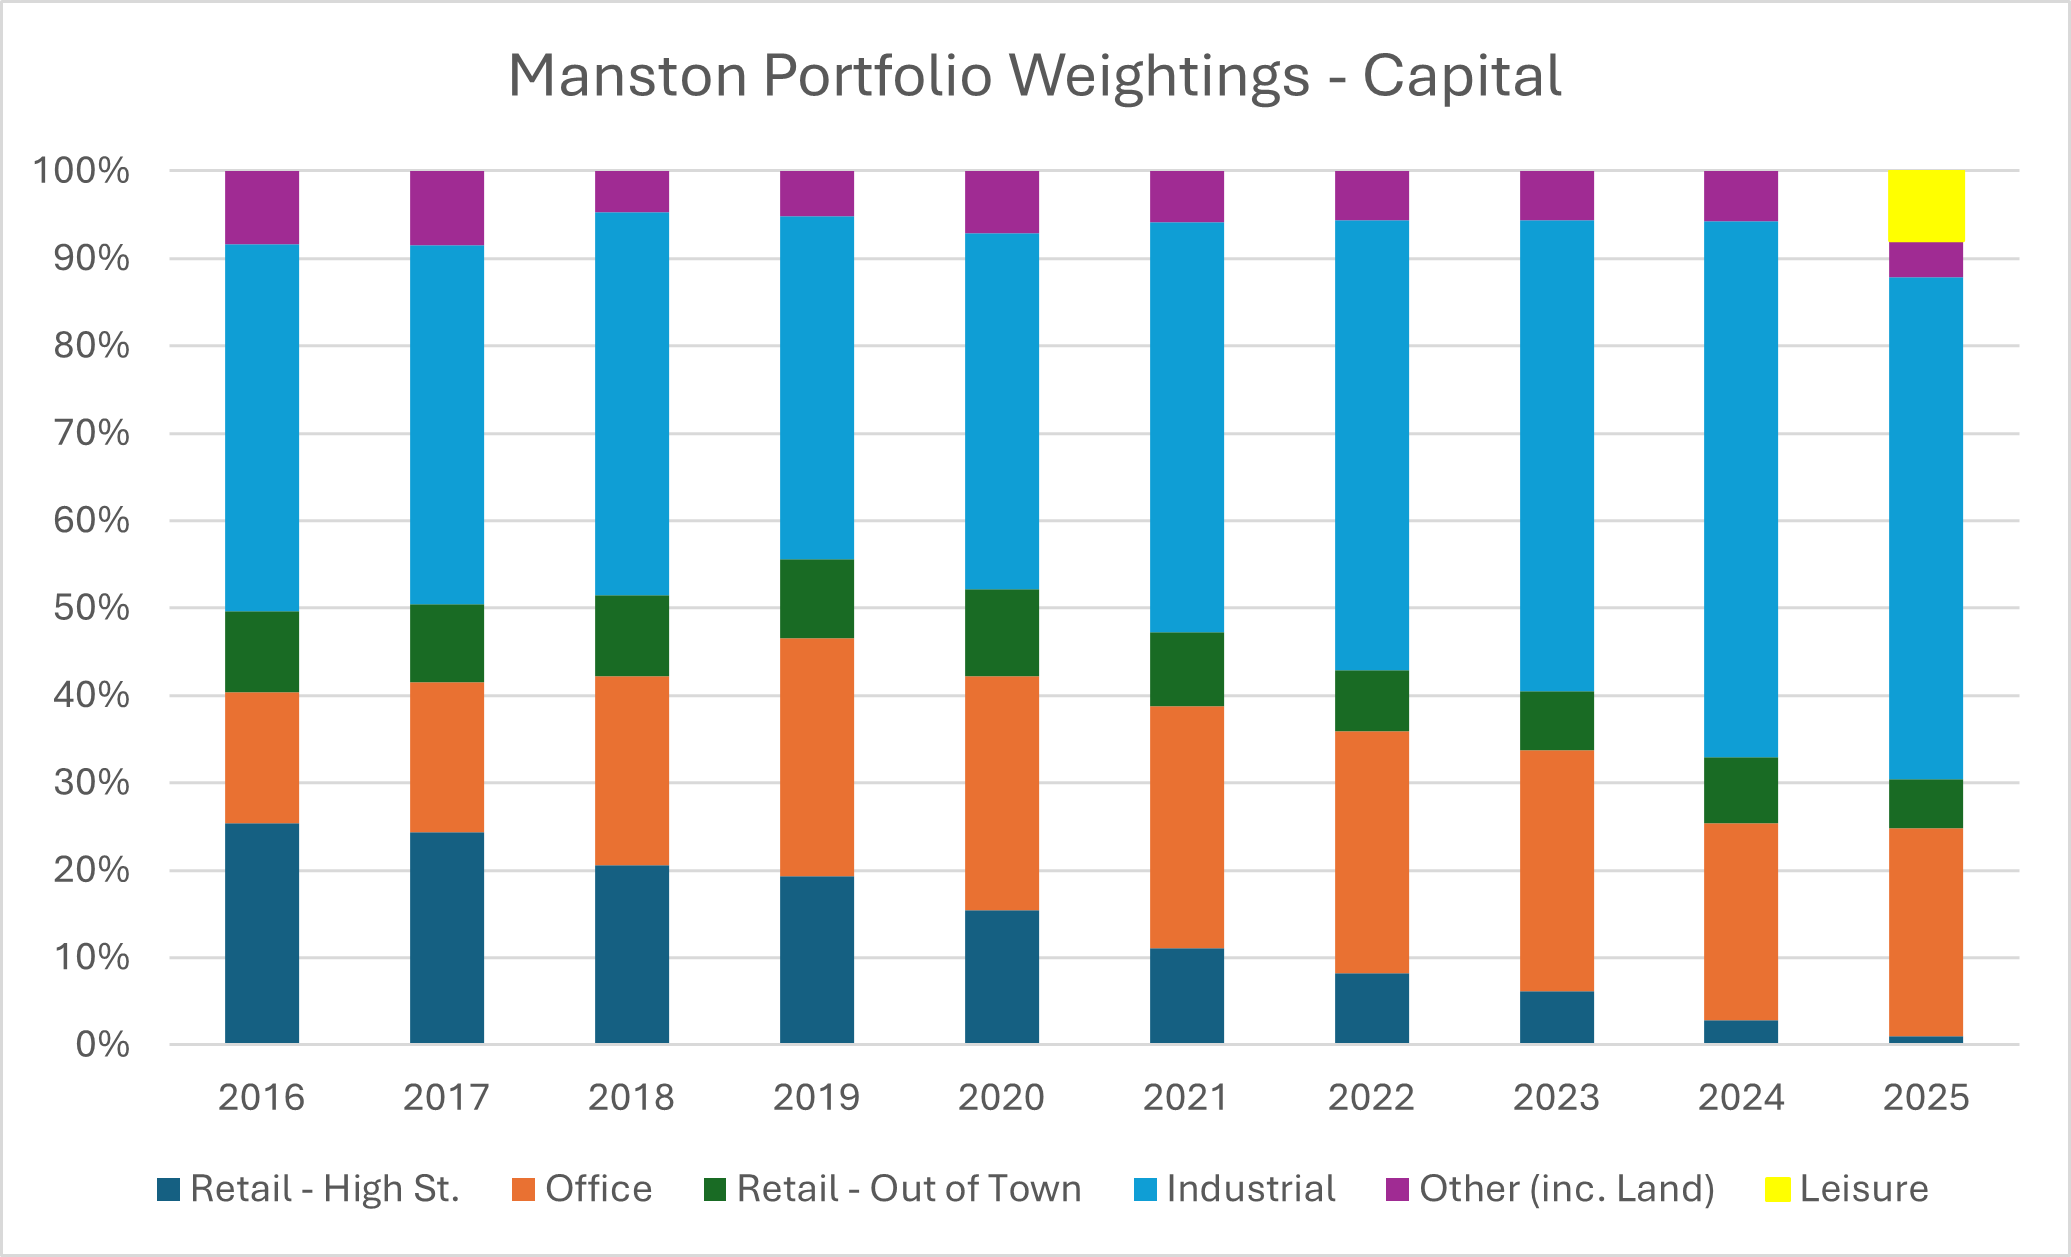
These trend weightings need to be considered carefully – they reflect not just market values within the wider sector, but also in-organic trends – acquisitions and disposals.
Alongside capital weightings – we also measure our income weightings per sector.
As a final element to this sub-set of KPIs, we also include average sector yields. ‘Average’ is arguably one of the most dangerous words in the management accounting tool-kit – covering a multitude of data points in one catch-all figure (voids, un-economic assets, etc.). However – as long as you are aware that the devil lurks in the detail, this is a handy heuristic to compare sector trends across the portfolio. Again – KPIs are signposts to more detailed analysis – and need to be taken in context, rather than as an answer to a (meaningful!) question.
Property Concentration
‘Don’t have all your eggs in one basket’ – wise words indeed. At Manston we don’t want one or two large investments dominating the portfolio – with the ‘cliff edge’ risks associated with that approach. At Manston, our largest property by capital value accounts for c. 13% of the portfolio, with our top 10 accounting for 61%. Arguably this is a little top-heavy, statistically at least, but . . .
. . . an element of subjectivity needs to be considered here. Having 50% of your portfolio let to the Bank of England is less risky (from a covenant perspective, although it does come with corresponding downsides such as incredibly low yields – I would imagine!) than having 25% of your portfolio let to ‘M. Miggins’ Pie Emporium’ sole traders and 25% to ‘Baldrick’s Potato Shoppe’ at sky-high yields and suspect covenants – this is very much data that needs interpretation, rather than inferring anything too directly. It raises more questions and directs to the underlying information – which good KPIs should.
Is there some incredibly clever, algorithmic way of distilling the range of subjective considerations into a single objective number? Credit-weighting the tenant exposure, poly-nomial algorithms, quantum lease-engineering, crystal-ball gazing, ‘black box’ gubbins et al.? (I did try reading tea-leaves, but made an awful mess on the board-room table and drove our wonderful cleaner, Tracy, to distraction.) Yes – you could do this, but it would still be unavoidably subjective but now it would be subjective and complex. Don’t let ‘great’ be the enemy of ‘good’ and ‘Keep It Simple (Stupid)’.
Sometimes – complexity is beautiful; more often – it’s a cloak behind which incompetence hides.
Portfolio EPC
As a responsible investor – we want to know the Energy Performance of our assets. We want to know where CAPEX can be sensibly deployed to improve under-performing assets. We want to ensure that we are providing (at a bare minimum) regulatory adherence, and providing what tenants increasingly want.
Whether the Government will stick to historic claims and look to ‘bar’ the letting of assets below a ‘B’ rating – we don’t know. Nor particularly do we care – we want to aim for this target because it is the right thing to do, regardless of any regulatory ‘sticks’.
This isn’t just high-minded altruism on our part – we know that more energy efficient properties attract better tenants, at more competitive rents, for longer terms. Who said good business can’t be environmentally sound business?
Over 2/3 of our portfolio is EPC A or B by capital value, with some 98% A/B/C. And we are constantly improving this metric.
Charging
An extension of the ‘LTV’ KPIs covered in the previous ‘Finance’ article – this simply expresses (at book value) the % of the portfolio with a fixed charge against it. In effect, it shows how much security ‘dry powder’ we have.
Historically, Manston was organised somewhat differently – and it made sense to keep certain assets without charge – but as we now maintain a floating charge over all our assets – we are pushing to increase the level of fixed charge to the maximum. Why give an asset to the bank if things go badly (floating), but not make the most of the security it can provide to you by supporting actual leverage (fixed)? Having ‘dry’ security also ensures that we are well positioned to draw down new term debt incredibly quickly (cross-reference our bank ‘overhead’ from our Finance KPIs).
Vacant Property Costs
You don’t just need to know how much your let properties are making you – you need to know the real costs of your empty properties. Nothing sharpens the mind like seeing the real cost of an empty office.
Here, we look at both the actual costs of having empty properties (rates, utilities, security, insurance, etc.) but also the opportunity cost of what it could be earning us.
At the time of writing – Manston have one void across their entire portfolio. Actual costs incurred for the year to date amount to 1% of revenue, with a further 2% of revenue that is the opportunity cost of ‘lost rent’.
Back in 2020 – this peaked at 12% of rent lost to actual costs and 34% rent foregone. Having laser-focussed KPIs ensured close and attentive management of this issue and has led us to the positive position we are in now, and where we hope to remain (close to, if not actually at!).
Net Cash (Under)Overage on Sales
Not a feature in our quarterly Board papers – but certainly a key feature of our year end reporting to our stakeholders.
As a private business – we are not obliged to ‘red book’ value our properties every year (although we regularly red-book those with a fixed charge against them). We value our book internally once a year for our statutory accounts, with the aid of Property Consultant.
This KPI is simply the expression of what we sell a property for against what we had it valued at.
This is a hugely reassuring KPI for keeping the executive ‘honest’ in their valuations. It would be far too easy to ‘pump up’ valuations at year end – making a nice unrealised gain, an attractive P&L and pats on the back all around for being so clever. This is all fun and games until you look to dispose of an over-inflated asset and the market gives you a sharp wake up call and a realised loss. Explain that to your investors.
Between 2019-2024, we have averaged a c. 12.5% gain on book value upon disposal. We are fundamentally conservative in our investment outlook and do not engage in fits of uber-optimism. We want our book value to reflect real worth, not ‘hope value’. Any fool can make an un-audited, un-realised gain – realisation is what separates speculators from stewards.
Is this metric perfect? No! But it does tell a high-level story that every investor should want to read – are my executive (a) competent at valuation, (b) really holding themselves to account for poor performance, as well as good performance.
—
These are the key ‘property’ metrics that we monitor. As with the financial ones – they are not exclusive, we monitor far more than these ‘off’ the KPI page and there are undoubtedly a host more that others will use and find useful.
Next, we will look into the final section of our KPI suite – those concerning our tenants and our leases.